This is the second post of the series of tutorials about custom plugins. If you haven’t created your first plugin yet, we recommend you take a look at our first post.
How to load my plugin into the tool?
On this post, we’ll use the plugin we created before and follow the steps to use it within the Unit Platform.
In the Multisite Monitoring product, click on Plugins > Custom Plugins > Add Plugin:
Access Multisite Monitoring
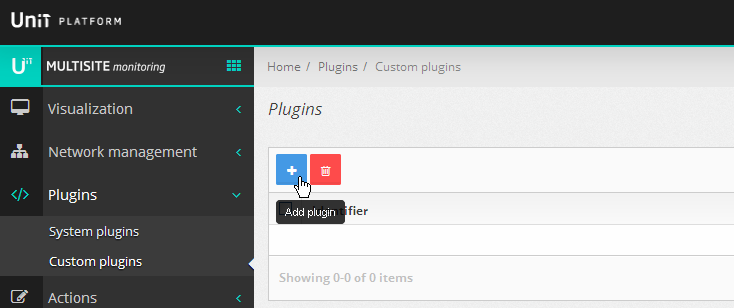
Add plugin
Step 1: General information
There are 3 steps that we must follow to upload a plugin. This first step requires some general information about the plugin:
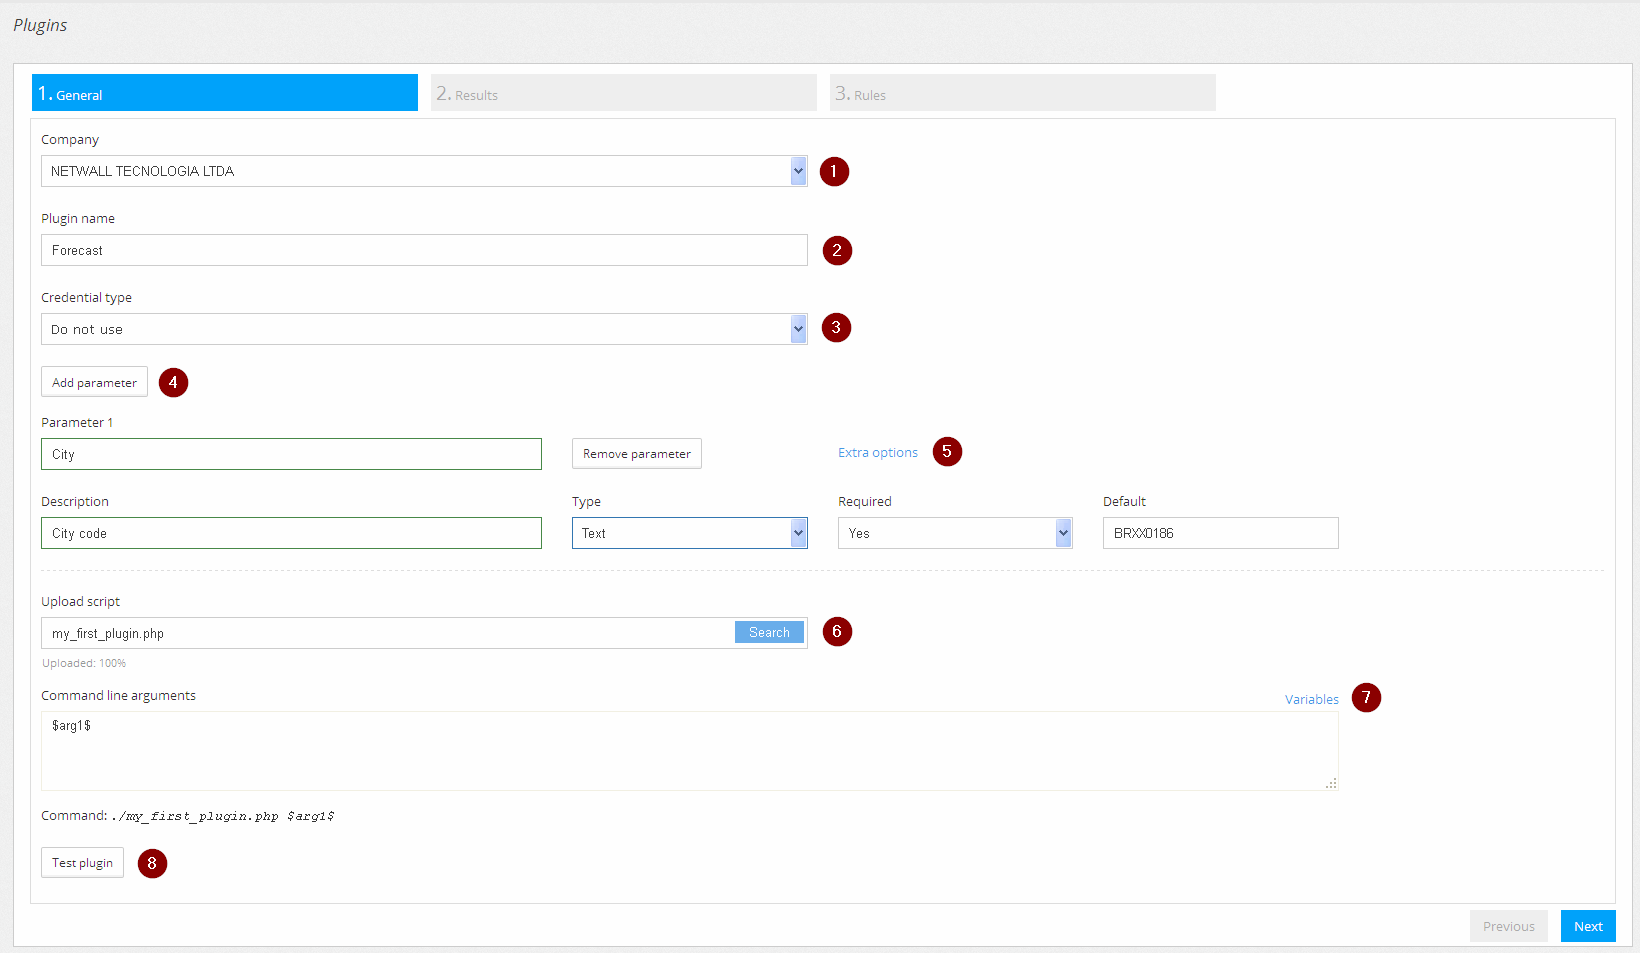
General information
Where:
- Company: Name of the company that will use the plugin. For security and privacy reasons, custom plugins are linked to only one company, meaning other companies will not be able to see it, nor use it.
- Plugin name: Name that will be displayed in the monitoring interface.
- Credential type: Don’t select anything.
- Add parameter: Click “Add parameters”, for this plugin requires an input (city code).
- Parameter 1: Fill in the name of the argument. In this case, we put “City”.
- Extra Options: A few more fields will be displayed. Fill in as shown.
- Send script: Click “Select” and upload the file “my_first_plugin.php”.
- Command line arguments: This step defines how data input will be passed on to the plugin. For every parameter added on step 4 above, one entry must be added here. In this example, we have only one parameter, so just type $arg1$. In the case the plugin has more than one argument, each one must be added to the command line properly indexed. Example: $arg2$, $arg3$, and so on. This must match the plugin’s command line as described here, in the section “Argument Input”.
- Test plugin: click to verify if everything is correct.
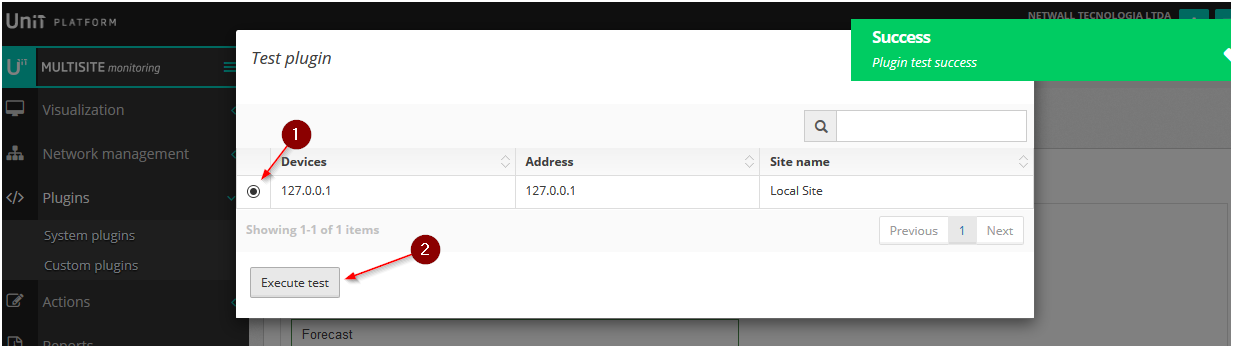
Plugin test
Select a device and run the test. You should see a message stating the execution was a success. Selecting a device is required because all the services that are registered for monitoring must be linked to a device. If the test is successful, a message will be shown and the system will advance automatically to the next step.
Step 2: Plugin output
Enter the type of outputs (1), output name (2) and color. Click the Next button.
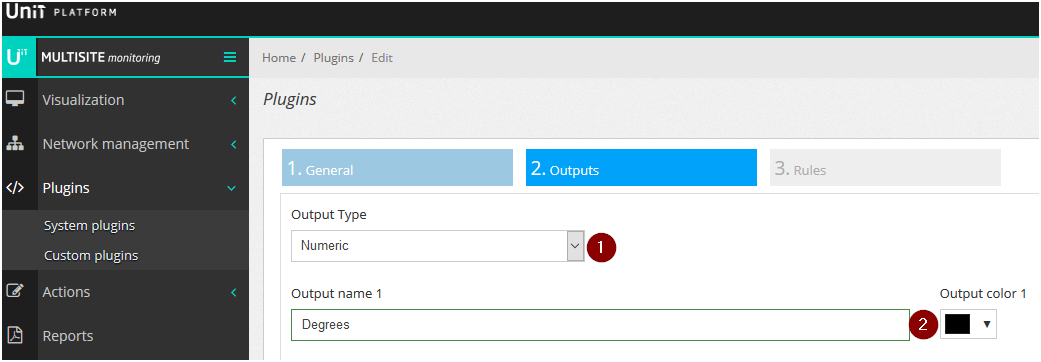
Plugin Output
Step 3: Monitoring rules
This last step defines the default template for monitoring rules. It is necessary to add at least two rules.
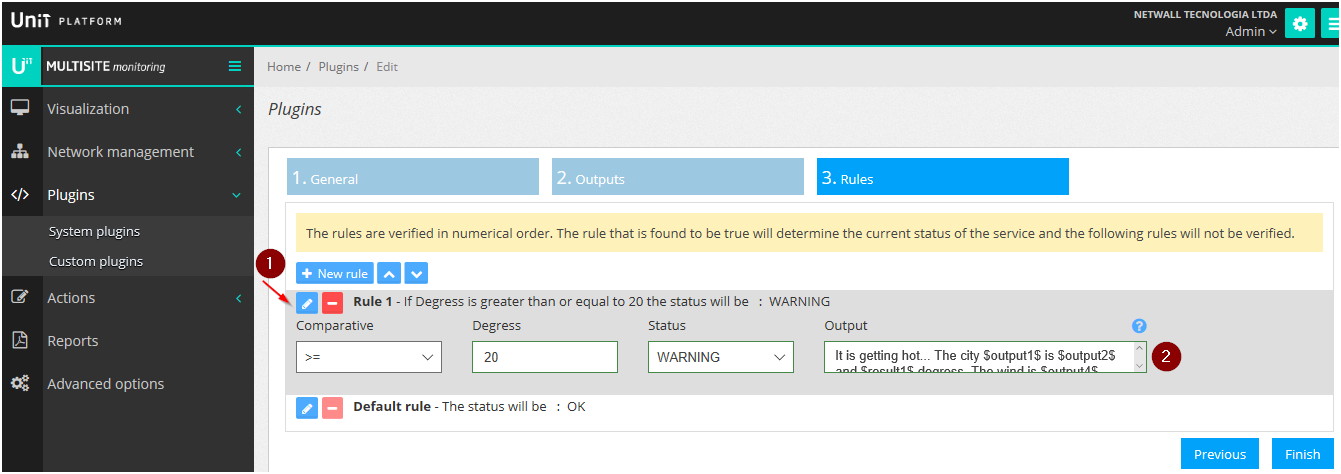
Monitoring rules
Default monitoring rules
Rule 1 specifies that, when the city’s temperature is above 20 degrees Celcius, the plugin must show the WARNING state. For that, we used the comparison “>=” with “20” degrees and specified the “WARNING” status. This is just an automatic template to show up when a service is added. These parameters can be changed at any time, both in the template and in the service itself.
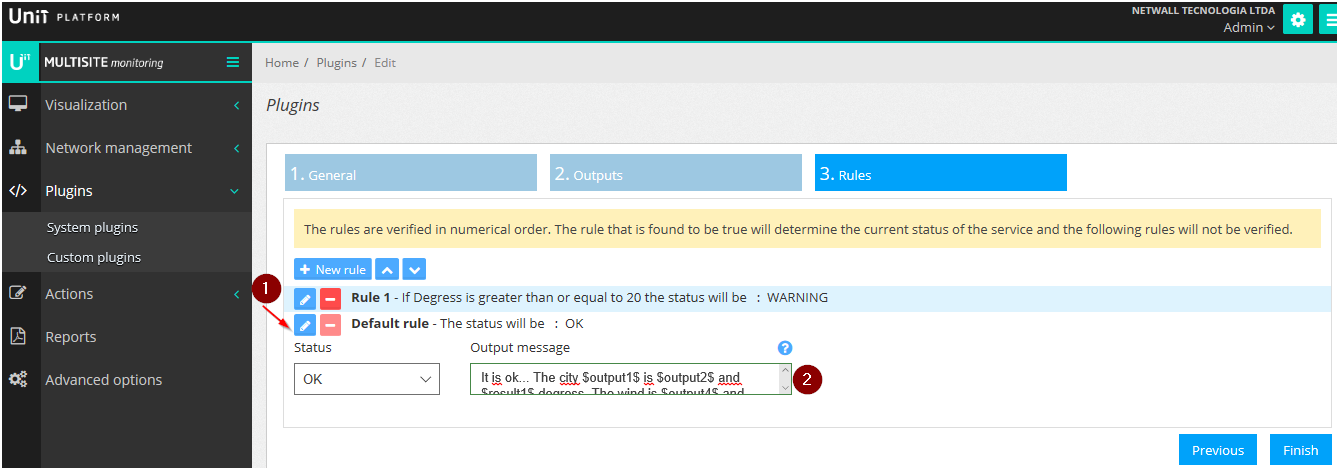
The default rule is the OK state, that is, when the temperature is not “greater than or equal to 20”, the plugin will assume this state.
The output texts of the images are:
Rule 1: It is getting hot... The city $output1$ is $output2$ and $result1$ degrees. The wind is $output4$ and the humidity is $output3$
Default: It is ok... The city $output1$ is $output2$ and $result1$ degrees. The wind is $output4$ and the humidity is $output3$
The $output$ variables are used to get the values returned in the auxiliary strings defined here, in the section “Plugin Output”. The indexes are used to get the values of a specific position. The $result$ variables follow the same logic, but return the plugin’s results.
Creating a monitoring service using a custom plugin
Now that the plugin has been loaded by the tool, it can now be used in the monitoring by following the instructions below:
Edit the desired device and add the service manually:

Choose a device to add the service
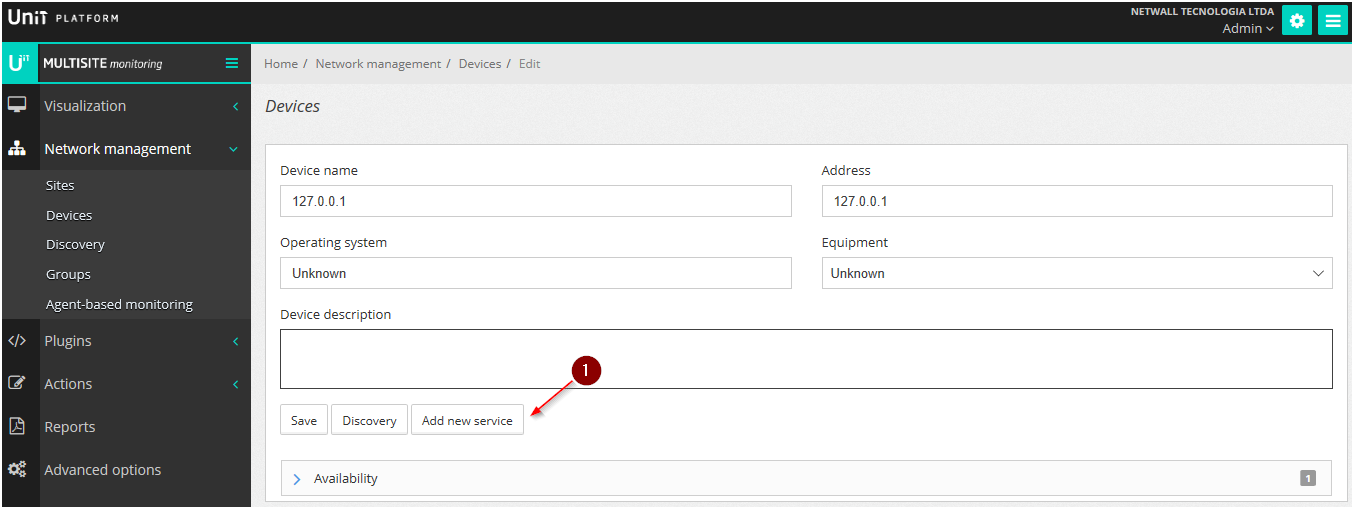
Click on Add new service
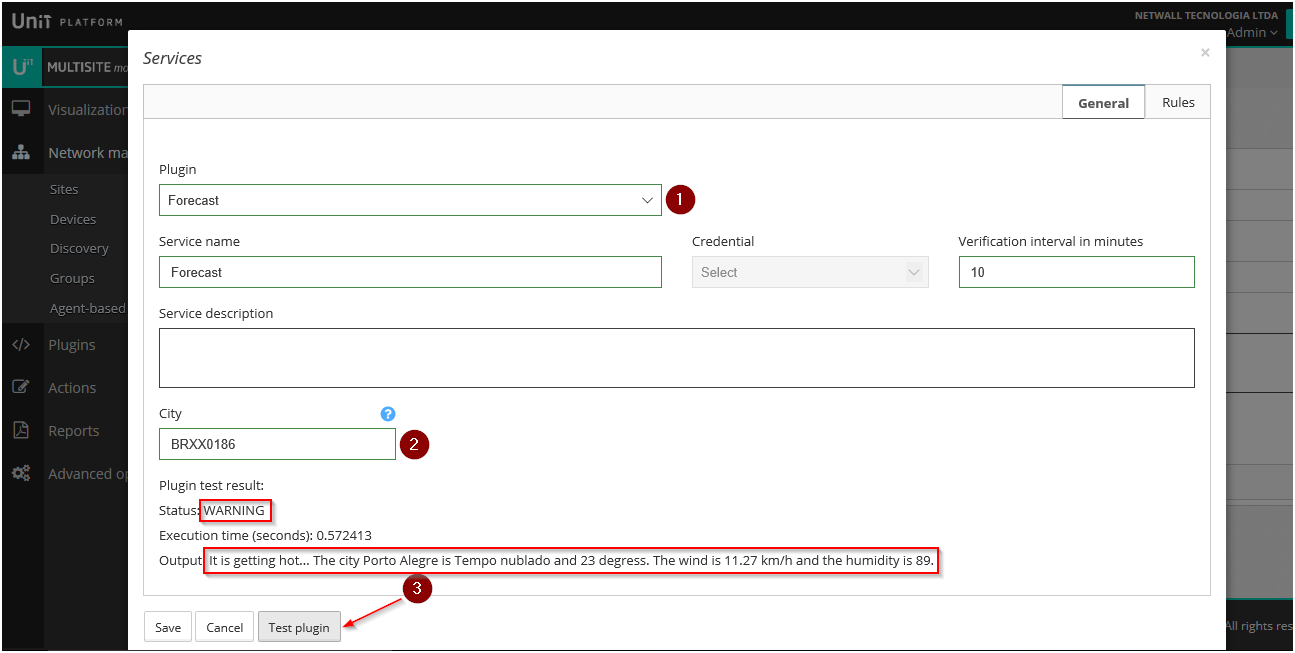
Choose the plugin created before
When you run the plugin’s test, the output state and text will be shown.
At the moment of execution, the state was “WARNING” because in Porto Alegre it was above 20 degrees Celsius.
To search for other city codes, go to the following website:
https://hgbrasil.com/status/weather/
After successful testing, save the registration. In this same interface, if you want to change the rules, there is a tab in the upper right corner called Rules.
You can add multiple services from multiple cities, taking care not to duplicate service names.
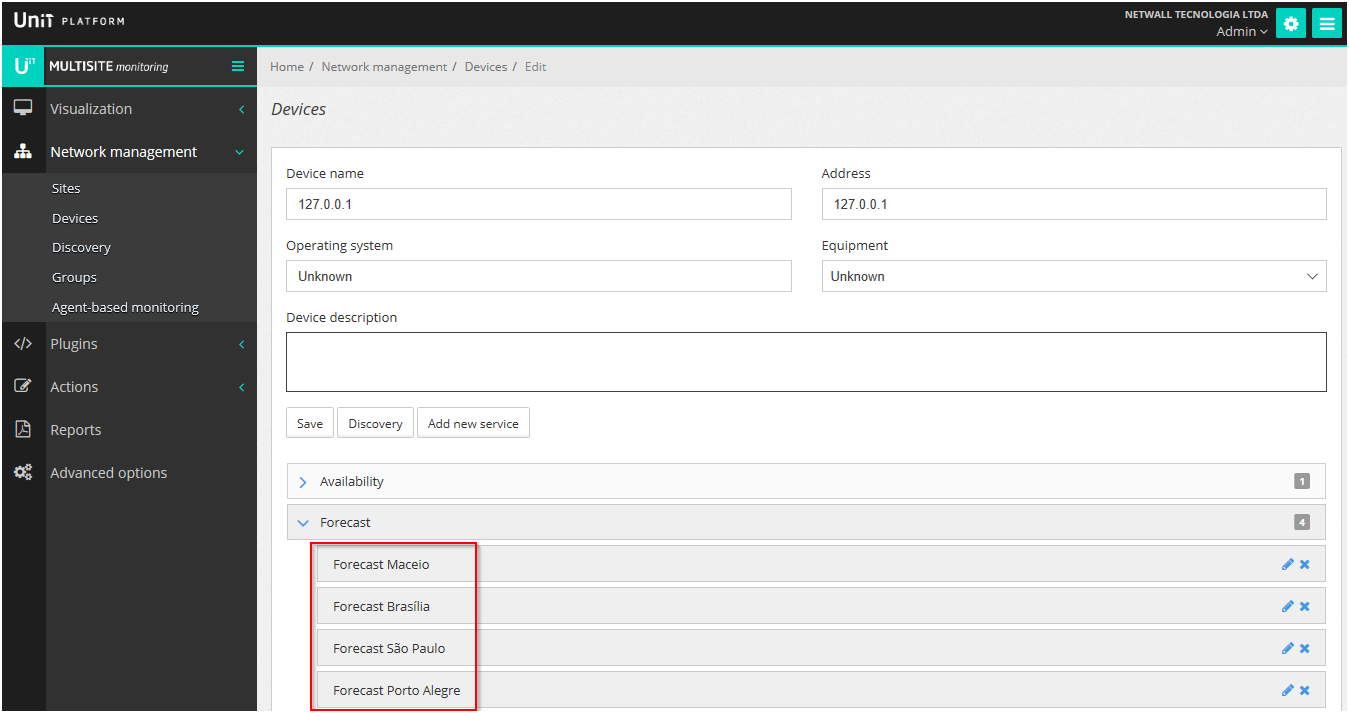
Adding various services
In this example, we’ve added four services with the following codes:
- Maceió: BRXX0143
- Brasília: BRXX0043
- São Paulo: BRXX0232
- Porto Alegre: BRXX0186
However, in the Maceio monitoring we changed the rule to be in the “WARNING” state above 30 degrees Celsius and created one more rule to be in the “CRITICAL” state above 38 degrees Celsius.
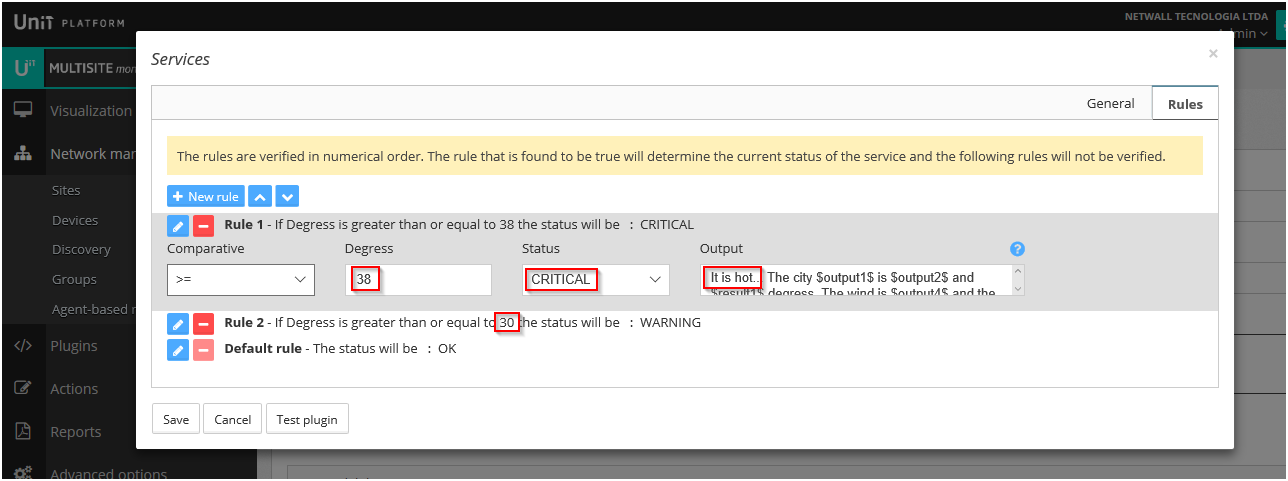
Editing the monitoring rules
Viewing the monitoring results
To view the monitoring items, you must enter Visualization > Monitoring status. Use the search field to locate the services that were added.
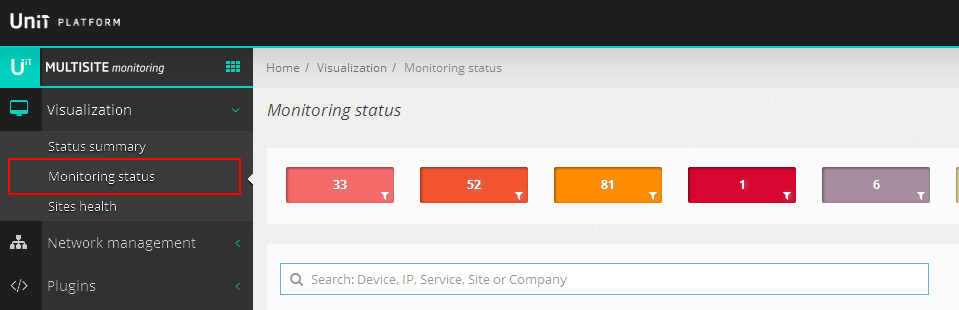
Monitoring status
The next post is going to show how to create more advanced plugins and how to use credentials.